| Copyright | (C) 2023 Alexey Tochin |
|---|---|
| License | BSD3 (see the file LICENSE) |
| Maintainer | Alexey Tochin <Alexey.Tochin@gmail.com> |
| Safe Haskell | Safe-Inferred |
| Language | Haskell2010 |
| Extensions |
|
Debug.SimpleExpr.Tutorial
Description
Tutorial, Quick start or Demo for 'simple-expr' package.
Synopsis
Quick start
>>>import Prelude (String)>>>import Debug.SimpleExpr (variable, unaryFunc, binaryFunc)>>>import NumHask (sin, (**))
Let us build an example symbolic expression for
\[ f(x) := \sin x^2 \]
It can be done as follows
>>>x = variable "x">>>sin (x ** 2)sin(x^2)
where terms x and sin (x ** 2) have type SimpleExpr.
It is just a syntactic tree where the role of leaves is played by
variables and numbers.
We used
variable :: String -> SimpleExpr
to build the expression for variable x.
For the sine function we attracted a predefined term
sin :: SimpleExpr -> SimpleExpr.
As well we can define a custom function using unaryFunc and binary functoins using binaryFunc as follows
>>>f = unaryFunc "f">>>(-*-) = binaryFunc "-*-">>>f x -*- f xf(x)-*-f(x)
There is also a typeclass Expr that includes SimpleExpr as well as it's tuples and lists.
Expression simplification
>>>import Prelude (($))>>>import Debug.SimpleExpr (variable, simplify)>>>import NumHask ((+), (-), (*))
We can try to simplify an expressions with the aid of quite a primitive simplify method
>>>x = variable "x">>>simplify $ (x + 0) * 1 - x * (3 - 2)0
Visualisation
>>>import Debug.SimpleExpr (variable, unaryFunc)>>>import Debug.SimpleExpr.GraphUtils (plotExpr, plotDGraphPng, exprToGraph)>>>import NumHask (exp, (*), (+), (-))
There is a built-in tool to visualize expression that attracts graphite package to transform expressions to graphs and graphviz to render the images.
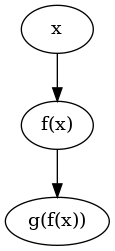
Consider first a simple composition for two functions f and g
>>>x = variable "x">>>f = unaryFunc "f">>>g = unaryFunc "g">>>expr = g (f x)>>>exprg(f(x))
This symbolic expression can be plotted by
plotExpr :: Expr d => d -> IO ThreadId
like
plotExpr expr

To save the image as a file use, for example,
plotDGraphPng (exprToGraph expr) pathToFile ,
where
exprToGraph :: Expr d => d -> DGraph String ()
transforms an expression to a graph and
plotDGraphPng :: DGraph v e -> FilePath -> IO FilePath.
plats the graph.
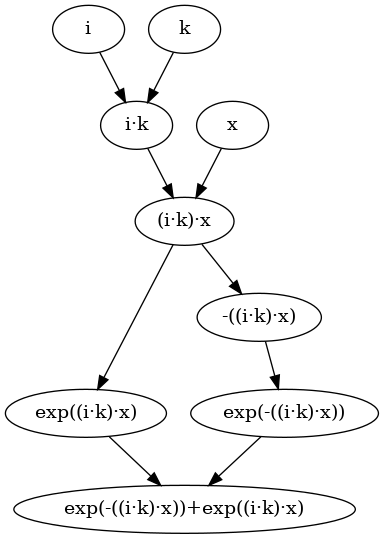
Consider now a more representative example
\[ e^{i k x} + e^{ - i k x} \]
>>>:{x, k, i, expr :: SimpleExpr x = variable "x" k = variable "k" i = variable "i" expr = exp (i * k * x) + exp (-(i * k * x)) :}
